Where Is My Package? Five Tracking Signals That Reveal If Your Content Actually Arrived
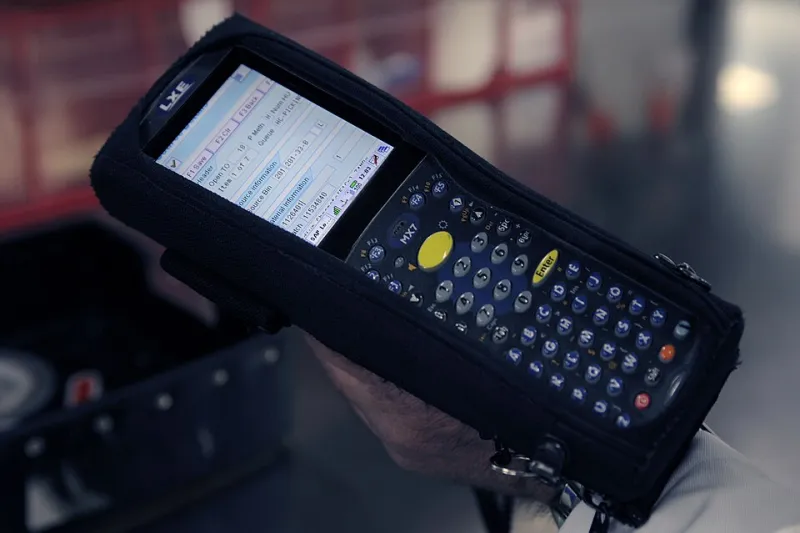
Photo: IAEA, CC BY-SA 2.0, via Wikimedia Commons
Type a tracking number into any carrier's website and you get something remarkable: certainty. You know the package left the facility, you know it cleared the hub in Louisville, and you know it's out for delivery in Austin. Now contrast that with the average content dashboard, which reports impressions and views but can't answer the only question that matters: where is this piece of content right now, and is it moving?
At Routes4Media, we think content teams should steal the tracking-number model wholesale. A package moves through a known sequence of checkpoints, and each checkpoint has a status. Your content does too. Below are the five tracking signals that turn a vague analytics page into an actual delivery map — including how to build each one and what red flags to watch for on the major platforms.
1. Time-to-First-Engagement (The "Label Created" Scan)
A tracking number's first scan confirms the package entered the system. For content, the equivalent is time-to-first-engagement: how quickly does a piece earn its first meaningful interaction after publishing?
How to set it up: Note the publish timestamp, then record when the first comment, share, or substantive click arrives. Most platforms show this in their native analytics; a simple spreadsheet column works. Healthy content on YouTube or Instagram typically earns first engagement within 30–60 minutes; on LinkedIn, within a few hours.
Red flags: First engagement arriving more than six hours after publish usually means the algorithm never picked the package up off your porch. Repeated slow scans across multiple posts suggest a posting-time problem rather than a content-quality problem.
2. Delivery Ratio (Delivered vs. Impressions)
Carriers distinguish between "shipped" and "delivered." Content analytics rarely do — which is why impressions get reported and reach-to-engagement conversion doesn't. Delivery ratio is the percentage of people who saw your content and then did something: clicked, watched past the hook, shared, or saved.
How to set it up: In any platform's analytics, divide engagements by impressions on a per-post basis. Benchmark against your own trailing 90-day average, not against industry folklore.
Red flags: High impressions with a collapsing ratio means your content is being delivered to the wrong address — the algorithm is showing it to a broad, uninterested audience, often after a topic drift or hashtag mismatch. On Facebook and Instagram, this pattern frequently follows a shift in content format that the distribution system hasn't re-learned yet.
3. Checkpoint Dwell Time (Where Content Gets Stuck)
Packages get stuck in hubs; content gets stuck in funnel stages. Dwell time tracking identifies exactly which checkpoint is holding your piece: seen-but-not-clicked (a headline problem), clicked-but-not-finished (a pacing problem), or finished-but-not-shared (a shareability problem).
How to set it up: For video, use retention curves on YouTube or Instagram. For written content, compare click-through rate against scroll depth or read-through metrics in your site analytics. Assign each underperforming post to a single stuck checkpoint.
Red flags: If 70% of your content consistently stalls at the same checkpoint, stop diagnosing individual posts and fix the stage itself. A stuck hub delays every package, not just one.
4. Route Variance (Platform-to-Platform Drift)
The same package sent via two carriers arrives on different schedules. The same content published on two platforms produces wildly different delivery profiles — and most creators never compare them. Route variance is the performance gap for identical content across channels.
How to set it up: Maintain a simple cross-platform log: same piece, same week, impressions and engagement per channel. Over a month, patterns emerge about which routes are reliable and which are chronically delayed.
Red flags: One platform consistently delivering at a fraction of its historical rate is a signal the route has changed — new algorithm priorities, new format preferences. This is your cue to reformat for that channel, not to abandon it.
5. Signature Confirmation (Delivery to a Human, Verified)
The final scan every shipper wants: someone signed for it. For content, this is verified arrival — a newsletter subscriber who clicked through, a viewer who followed you, a reader who returned within seven days. It is the only signal that confirms your content reached a person rather than a metric.
How to set it up: Track returning visitors in Google Analytics, subscriber click-through in your email platform, and follower conversion in native analytics. These three numbers together constitute your delivery confirmation rate.
Red flags: Growing impressions alongside flat signature counts is the classic hollow-growth pattern — your packages are being scanned at every hub and signed for by no one.
Build the Dashboard, Not the Delusion
None of these five signals requires enterprise software. A spreadsheet updated weekly captures all of them. What they require is a change in posture: stop asking "how many views?" and start asking "where is it stuck?" A tracking number doesn't tell you a package failed. It tells you where it failed — and that, in content distribution as in logistics, is the difference between guessing and fixing.